How to measure temperatures correctly
1. Environment and setup
Before you can do any measurements you need to be in a environment with a relatively steady ambient temperature, like your office, kitchen or living room. Place the computer on a flat table top, no table cloth or lap use.
You should be conducting the measurements using these practices:
- The MagSafe/power plugged in
- Optimization set to "Better Performance" in the "Energy Saver" system preferences panel
- Brightness turned up to full
- Wireless and bluetooth turned on
2. Warming up
Power up the machine and let the temperature of the components inside the machine level off with the surrounding ambient temperature for 10-15 minutes.
3. Software installation
- Hardware Monitor - Great tool with graphs plotting the temperature readings. Lacks some processor support, not all CPU temperature sensors supported, free
- iStat Menus - Complete package to monitor every prosess, storage, memory and sensors available on any Mac, including the latest models, free 15 day trail mode
- Intel Power Gadget - Intels official power, cpu usage and temperature monitoring tool, limited graphing, supports most Macs from 2012 and later, free
- Temperature Gauge - Simple and quick overview over all the temperature sensors on the system, chart temperature over time, average read-outs, 20USD App Store
- Macs Fan Control - Don't let the name deceive you, this tool includes temperature sensor readouts of most Macs, including the latest models, free
- iStat Pro - Widget that shows system essentials, good for Macs up to 2010, free
- MacBook/Pro Fan Control - Tool to make custom fan control curves, includes temperature sensor read-out, good for Macs up to 2009, free
- SpeedIt Extension - Kernel extension for 2006 to 2008 Macs, works with CoreDuo Temp and Hardware Monitor, free
- CoreDuo Temp - Simple tool to display the Intel Core Duo processor temperature, free
4. Start monitoring
Now start your favorite monitoring application.
If it has a graph, make sure to set the update interval to 1 second. Enable only the CPU core(s), GPU and drive sensors, disable any other sensor readings.
5. Idle temperature
Let the machine idle for 10 minutes without any applications open other than the monitoring application. Quit all open applications in the dock.
If you have excessively many background processes or widgets open other than what comes with a basic Mac OS X install, try to close these to simulate an average configuration of Mac OS X. This is to avoid incorrect readings of the idle temperature.
After 10 minutes, write down the idle temperature (average) shown in temperature monitoring tool.
Note about Core Duo CPUs: If your temperature does not exceed 30 °C, you are probably affected by the AE18 bug. Read more here.
5. Load temperature
Now it's time to really load the CPU cores to maximize the thermal heat output.
- MacOH - Ultimate tool for stress testing and testing the thermal system on any Mac, possible to check if prosessor is throttled under load, terminal based and automated, outputs a really handy graph, free
- yes command-line tool (preferred method) - This repeats a "yes" command as fast as the processor is able and makes for a reasonable good load, included in OS X. Open terminal and type 'yes >/dev/null', to abort press control+c. Open a new terminal for each processor core.
For a consistent result, re-run the load temperature measurement three times. This will make sure you are not getting any outliers in your readings.
Using yes command (preferred method):
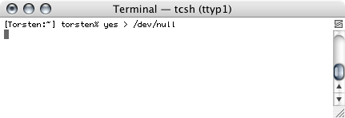
This will make one CPU core work as fast as it can. But with dual-core processors, there are two CPU processors and ONE application can only work on ONE core at a time. Therefore you need to open a new Terminal window by selecting File -> New and type the command again, like shown below:
yes >/dev/null
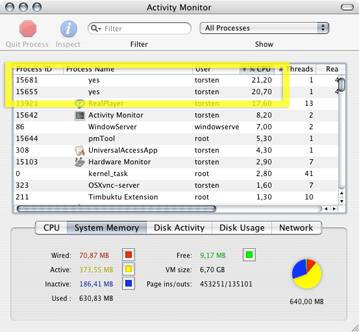
To verify that both CPU cores are under load, starting the Activity Monitor application in the Utilities folder. You will see that there are two processes called 'yes' using around '100%' cpu usage each.
Let the machine run for 10 minutes for the temperature to stabilize. You can see the temperature raising if you use a tool with graphing. After 10 minutes write down the load temperature (averaged) shown in monitoring tool.
Note: We're not looking for the peak temperature but the average temperature after the fans has kicked in and cooled the machine while under heavy load.
6. Drive temperature
Immediately after you've finished the load temperature recording, you can write down the drive temperature reported by the S.M.A.R.T sensor inside the drive.
7. Submit information
You should now have three different temperature readings; idle, load and hard drive temperature. Go to the submit form and enter this information along with the spesifications of your computer. Make sure to leave a comment.
Thanks for the effort!
Other useful tools:
- Turbo Boost Switcher - This lets you extend battery life by turning off the adjustable prosessor speed feature in Intel CPUs, locks to the lowest speed, free
- smcFanControl - Adjust the fan control curves on Macs up to 2012, limited cpu temperature read-out, free
- CoolBook - Allows you to adjust the cpu speed and voltage on MacBooks up to 2011, saves battery life and makes the machine run cooler, free
|